48 Moments
- Context:
- Academic
- Date:
- Launch:
Exploring Structures of Data, Knowledge & Information
For Structures, we were asked to collect and categorize 30—50 things. Each week we would be given a different structure through which we had to explore the relationships that existed between them.
I chose to record 48 moments as my source material. Every hour for 2 days I took note of a variety of parameters for each moment: where I was, what I was doing, who was there with me, how I was feeling, etc.
Over the following weeks the project went through 7 stages:
- Categorize and visualize a collection of 30—50 things
- Create a hierarchical xml schema of the collection
- Create a relational database of the collection as a csv file
- Using every word in the xml or csv file, write a story.
- Explore one of the structures generated so far visually with Processing
- A 3-hour charrette to translate some aspect of the project into a 3d physical model.
- Develop a concept and scale for the project and use this to design a more refined a 3d form.

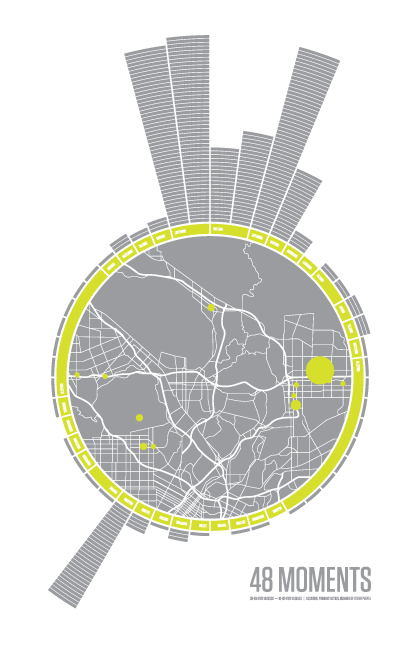
I initially presented these moments visually; creating a simple infographic plotting each moment’s location, the primary action I was involved in and the number of other people present.
Datasets and Story
We then created a number of further categorizations of our original objects—as a relational database, an hierarchical xml schema and a short story. I was intrigued by how the creation of each structure involved an element of re-living the moments and re-telling the story, and how the characteristics of each informed a very different ‘story’ in each case.
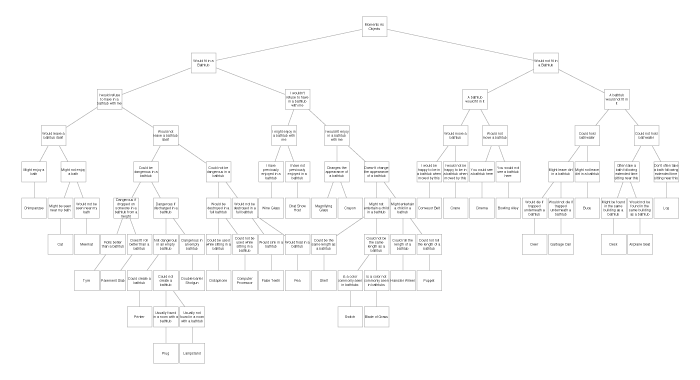
For the xml hierarchical schema, I wanted to take a less direct approach, so instead of selecting a symbol such as a numeral to represent one aspect of the moment, I chose an object that I felt represented something about the moment—perhaps a metaphor for that moment. Speeding down the freeway in the car with my wife—the two of us propelled at speed—became a double-barrel shotgun. Sitting on a sofa chatting to friends became a Talk Show Host. I started building the schema by answering a question about size—whether the object would fit in a bath tub or not—and decided to keep the bath tub as the point of reference throughout the schema.
The short story was then written using every word in the xml file.
Keith shuts the front door behind himself and drops his briefcase beside the lamp-stand. He switches on the bathroom light, steps inside and turns the tap to begin filling the empty bathtub. His head has been pounding since he landed, only to be made worse by tripping on a loose pavement slab outside the apartment building.
Visualizing through Code
For the next phase of the project, we were introduced to Processing and began to use code to explore the data structures we’d created. I explored a number of avenues for trying to create visual representations of the moments I had recorded.
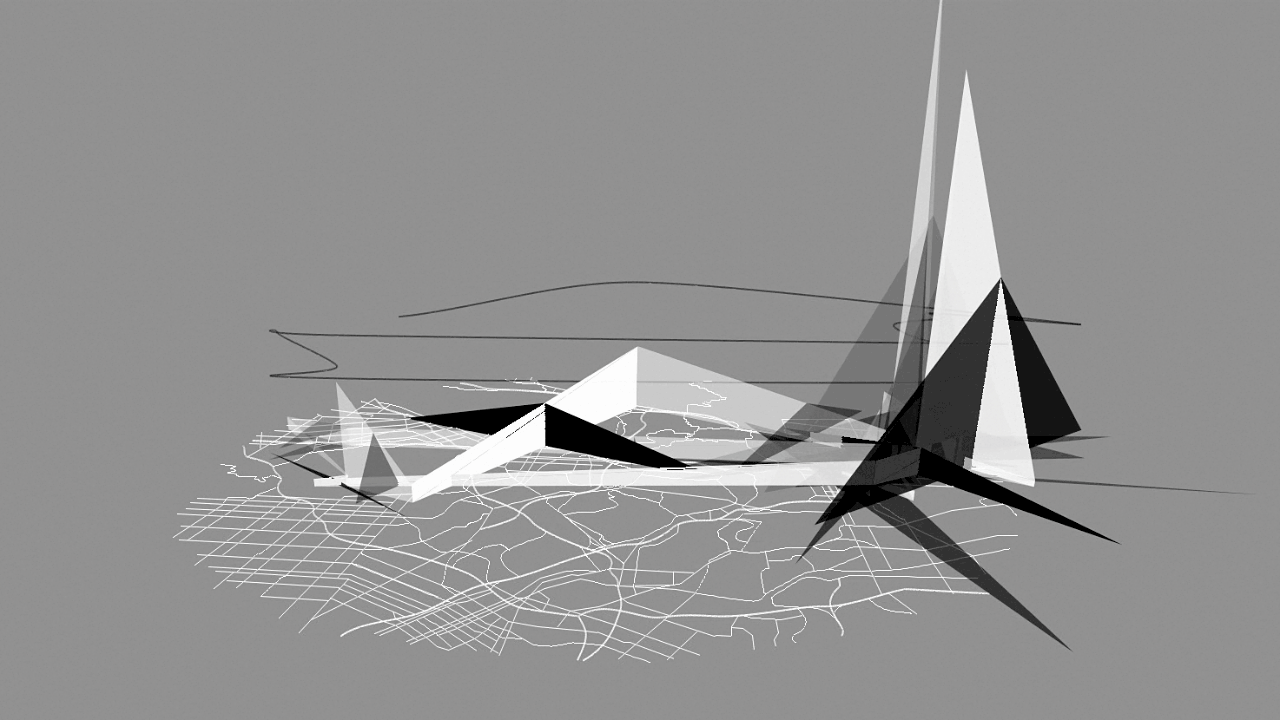
As my final for this part of the project, I mapped the moments in 3D space over a street map of Los Angeles and generated possible moments that may or could exist between these moments using basic algorithms.
In this Processing sketch I mapped the data in a 3D environment. The first black line shows the movement between the moments—laterally through longitude and latitude and vertically through time.
Then I used the duration of the moments (white polygons) and recorded emotions (pleasure: green line; distress: blue; appetite: orange; fear: yellow) to create a value system from which possible moments could be calculated and projected (black lines).
Final Stage
This project was taken one step further when we were asked to translate some aspect of our project into a 3D form.
